 |

tang-IT ARM Online Section |
tang-IT ARM analysisThe tang-IT ARM implementation allows to analyse the measured data in various ways. The following paragraphs provide a short overview of different kinds of analyses you can perform. Parent/child relationshipARM provides the ability to correlate different transactions as a parent/child relation. Our tools show a complete tree of parent/child transactions including recursive parent/child relations (a child can also be a parent of other transactions). The following example shows the measurement of an HTTP Request to a web server. This request has two child transactions, where ReadReq measures the execution time of reading the request from the client, and ProcessReq measures the processing of the request within the web server including logging the request which is also measured in this examples (LogReq).
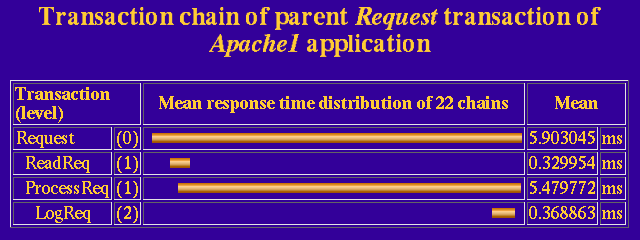
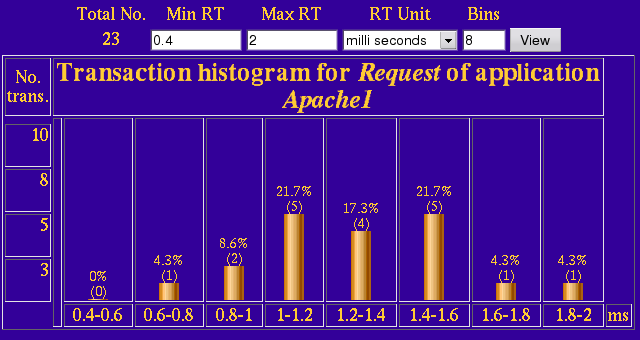
Statistical parent/child analysisA single transaction chain as shown above can only show a snapshot of the current execution. To get a better overview of an overall execution of such a transaction chain tang-IT ARM provides statistical metrics such as mean and median response times values for a set of transaction chains. The following Figure 1 shows the mean response time distribution of the Request transaction and its child transactions:  Figure 1: Mean response time distribution of a transaction chain with Request parent transaction of an Apache 1.3 web-server Transaction response time histogramsIn many cases measuring a single transaction will not provide enough information, therefore it is preferable to view the distribution of response times for a specific transaction over a time interval. A response time histogram will convey this information at a glance. The diagram below shows the frequency of average response times of Request transaction for an interval of two days.  Figure 2: Response time histogram of Request transaction of an Apache 1.3 web-server ARM transaction metricsIn addition to the standard measurement information ARM provides metrics which can embed a wide range of extra data directly associated with a single transaction. You may have noticed in the above parent/child relationship section that there are two columns (URI and Content-Length) semantically bound to the Request. These two columns are in fact ARM metric data slot 1 and slot 2 and in combination with the ARM metric definitions we can provide output specific to the Request. For more information about ARM metrics, please consult the ARM 4.0 standard documents. Statistical transaction metricsFor long running systems, a single transaction measurement does not really make sense. But statistical metrics aggregated from each incoming transaction are better indices if a system performs well. The tang-IT ARM implementation offers a wide set of statistical metrics for ARM transactions. Here is a short list of supported statistic metrics for a transaction:
All these statistic metrics can be calculated separately for each transaction status. For example you want the mean response time for a successful (ARM_GOOD) transactions and for aborted (ARM_ABORT) transactions. Here is an example for the previously mentioned HTTPRequest transaction:
ARM definitionsARM 3.0 introduced out-of-band definitions of transactions, metrics and users. Now ARM 4.0 has moved on and added also an application definition but does not require out-of-band registration anymore. Our implementation supports creating, viewing and editing of these definitions using different access tools and besides the standard way of creating ARM definition data through the standard ARM API. In the following there is a brief overview of definitions and there attributes:
|